


The Ministry of Statistics and Programme Implementation (MoSPI) released the sixth Periodic Labour Force Survey (PLFS) Quarterly Bulletin covering July–September 2026 on 10 November 2026. The bulletin presents employment and unemployment estimates for both rural and urban India under the Current Weekly Status (CWS) framework, drawn from a sample of 5,55,593 persons at the all-India level.
The headline numbers point to a modest tightening of the labour market. Unemployment eased, workforce participation widened, and rural employment in agriculture jumped as Kharif operations peaked. The quarter’s numbers are available in the MoSPI Quarterly Bulletin PDF.
Labour Force Participation Rate: Rural Pulls the Overall Figure Up
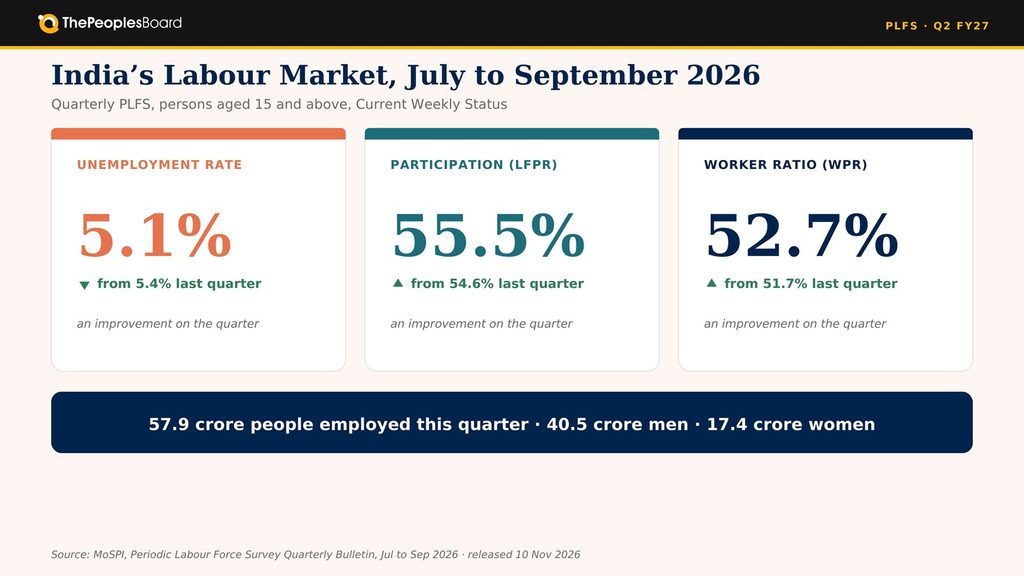
The overall Labour Force Participation Rate (LFPR) for persons aged 15 years and above stood at 55.5% during July–September 2026. That’s a 0.9 percentage point jump from 54.6% in April–June 2026, and a 0.4 percentage point rise over the same quarter of 2025.
Rural LFPR did most of the lifting. It moved up to 58.1% from 56.9% the previous quarter, logging a year-on-year increase of 0.9 percentage points. Urban LFPR edged up marginally to 50.4% from 50.2%, but slipped 0.3 percentage points year-on-year. India’s April–June 2026 PLFS numbers had shown an urban push. That pattern has now rebalanced toward rural.
Female LFPR saw the sharpest swing in absolute terms, climbing to 34.7% from 33.2% the previous quarter.
| Indicator (15+ years, CWS) | Jul–Sep 2026 | Apr–Jun 2026 | Jul–Sep 2025 |
| Overall LFPR | 55.5% | 54.6% | 55.1% |
| Rural LFPR | 58.1% | 56.9% | 57.2% |
| Urban LFPR | 50.4% | 50.2% | 50.7% |
| Female LFPR (overall) | 34.7% | 33.2% | n/a |
Worker Population Ratio Climbs One Percentage Point
The Worker Population Ratio (WPR) for persons aged 15 and above rose to 52.7% during the quarter, up from 51.7% in the April–June window. On a year-on-year basis, the overall WPR climbed 0.5 percentage points.
Rural workforce density did most of the heavy lifting here too. WPR in rural areas rose to 55.6% from 54.2% the previous quarter, an increase of 1.4 percentage points. Urban WPR stayed near flat, moving from 46.8% to 46.9%.
Male WPR climbed to 73.4% from 73.0%, while female WPR jumped 1.5 percentage points to 32.8% from 31.3%. Rural WPR gained 0.9 percentage points year-on-year, in line with the direction India’s female workforce participation has been trending across annual PLFS cycles.
Unemployment Rate: Rural Drives the Dip
The overall Unemployment Rate (UR) for persons aged 15 years and above fell to 5.1% during July–September 2026, down from 5.4% in the previous quarter. Compared with the same quarter of 2025, the rate improved by 0.1 percentage point.
Rural unemployment carried the entire quarter’s improvement. The rural UR dropped to 4.3% from 4.8%, while urban UR stayed broadly stable at 6.8% versus 6.7% the previous quarter. Rural male UR fell to 4.4% from 4.7% year-on-year. In urban areas, both male UR (6.2% to 6.1%) and female UR (9.0% to 8.8%) registered marginal year-on-year improvements.
Employment Status: Self-Employment and Salaried Work Both Rise
The quarter saw gains at both ends of the employment-status spectrum. Rural self-employment widened, urban regular wage work edged up, and casual labour shares fell in both sectors.
Share of Workers by Status in Employment
PLFS splits every worker into three mutually exclusive buckets: self-employed, regular wage or salaried, and casual labour. The quarter-on-quarter movement across these categories tells a clearer story in rural areas than in urban ones.
| Status | Rural (Jul–Sep 2026) | Rural (Apr–Jun 2026) | Urban (Jul–Sep 2026) | Urban (Apr–Jun 2026) |
| Self-employed | 62.7% | 61.4% | n/a | n/a |
| Regular wage/salaried | n/a | n/a | 49.6% | 49.3% |
| Casual labour | 21.7% | 22.5% | 10.7% | 11.1% |
Year-on-year, rural casual labour fell by 0.5 percentage points (from 22.2% to 21.7%) and urban casual labour by 0.2 percentage points (from 10.9% to 10.7%). Formalisation of rural wage work also inched forward, with regular wage/salaried employment rising 0.6 percentage points year-on-year, tracking the broader direction of the four Labour Codes implementation.
Sectoral Distribution of Rural Workers
Rural employment pivoted sharply toward agriculture during the quarter, reflecting Kharif sowing and harvest activity. In urban areas, secondary and tertiary sector shares stayed broadly stable.
| Sector | Jul–Sep 2026 | Apr–Jun 2026 | Jul–Sep 2025 |
| Rural agriculture | 56.7% | 52.9% | n/a |
| Rural secondary (incl. mining) | 21.9% | 24.4% | 21.0% |
| Rural tertiary | 21.4% | 22.7% | 21.3% |
Youth and State-Level Picture
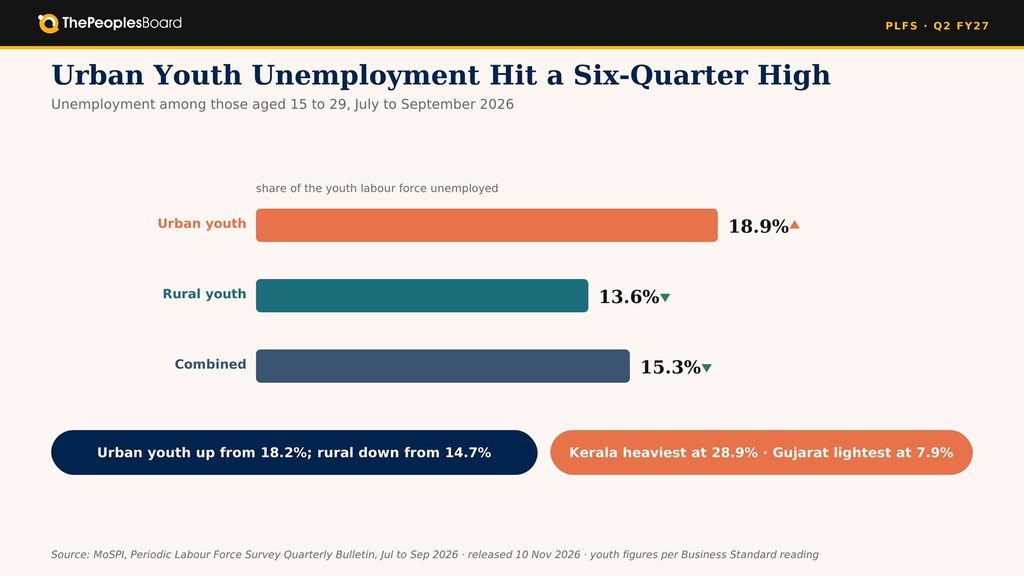
Youth unemployment moved in opposite directions depending on where you looked. Urban youth bore the brunt, while rural youth saw clear relief.
Youth Unemployment (Aged 15–29)
Based on Business Standard’s reading of the bulletin, urban youth unemployment rose to 18.9%, a six-quarter high, from 18.2% in April–June 2026. Rural youth unemployment fell to 13.6% from 14.7%, pulling combined youth unemployment down to 15.3% from 15.9%.
Spread Across States
Of the 20 states covered, Kerala recorded the highest overall unemployment rate at 8.7%, followed by Punjab and Andhra Pradesh at 7.8% each. Kerala also carried the heaviest youth unemployment burden at 28.9%, while Gujarat sat at the other end of the youth distribution with 7.9%.
Workers in Absolute Numbers
MoSPI estimated the total number of workers aged 15 and above using Ministry of Health and Family Welfare population projections. On average, 57.9 crore people in that age group were employed during the quarter: 40.5 crore men and 17.4 crore women.
In the End…
The July–September PLFS release lands as hiring teams calibrate annual plans and compensation reviews. The quarter’s main shifts (a 0.3 percentage point fall in overall UR, a 1.0 percentage point rise in WPR, and the climb in rural self-employment) carry different signals for different functions.
Talent acquisition teams can benchmark urban youth unemployment against their fresher pipeline, workforce planning leads can cross-check regional staffing assumptions against state-level rates, and compliance teams tracking formalisation can read the uptick in regular wage work against their own payroll data. The next quarterly bulletin, covering October–December 2026, is scheduled for release in early February 2027.